Offer Valuation Analysis · 465 Blossom Hill Rd · San Jose, CA
465 Blossom
Hill Road
A defensible offer range for a 10,800 SF Class C retail building on the Blossom Hill corridor — three valuation approaches reconciled into one number.
Subject's segment isn't tight — neighborhood centers are the highest-vacancy subtype in the submarket.
| Subtype | Vacancy | Asking Rent | YoY | Read |
|---|---|---|---|---|
| Mall | 3.6% | $44.08 | 1.3% | Tight |
| Power Center | 2.4% | $44.88 | 1.4% | Tightest |
| Neighborhood Ctr | 6.3% | $43.57 | 1.3% | Highest vacancy |
| Strip Center | 4.6% | $37.55 | 1.8% | Volatile |
| General Retail | 1.0% | $40.34 | 1.7% | Tight |
| Submarket Overall | 4.2% | $42.43 | 1.4% | Headline |
- NC vacancy peaked 9.2% in 2022 — improving but still above 2019 lows of 4.7%
- Submarket asking rent: $30/SF (2014) → $42.43 (YTD 2026); forecast $47.89 by 2030
CoStar — Vacancy Rate by Subtype
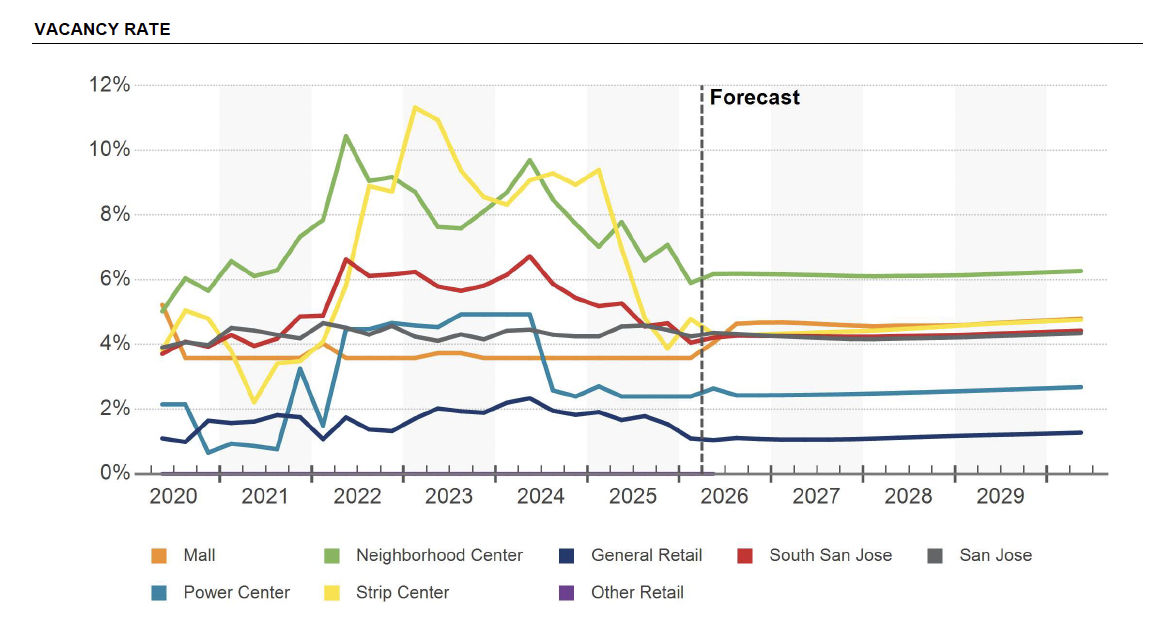
Neighborhood Center (green) sits visibly above all other subtypes — same story the table tells, in one chart.
Trends · Sales & Cap Rates
What buyers are paying — and absorbing.
20
Sale Comparables (12 Mo)
280K SF traded
5.3%
Avg Cap Rate
Submarket est. 5.6% · metro 5.7%
$302
Avg Price / SF
Submarket est. $472 · metro $493
20.3%
Avg Vacancy at Sale
Buyers routinely absorb material vacancy
CoStar — Market Cap Rate by Subtype
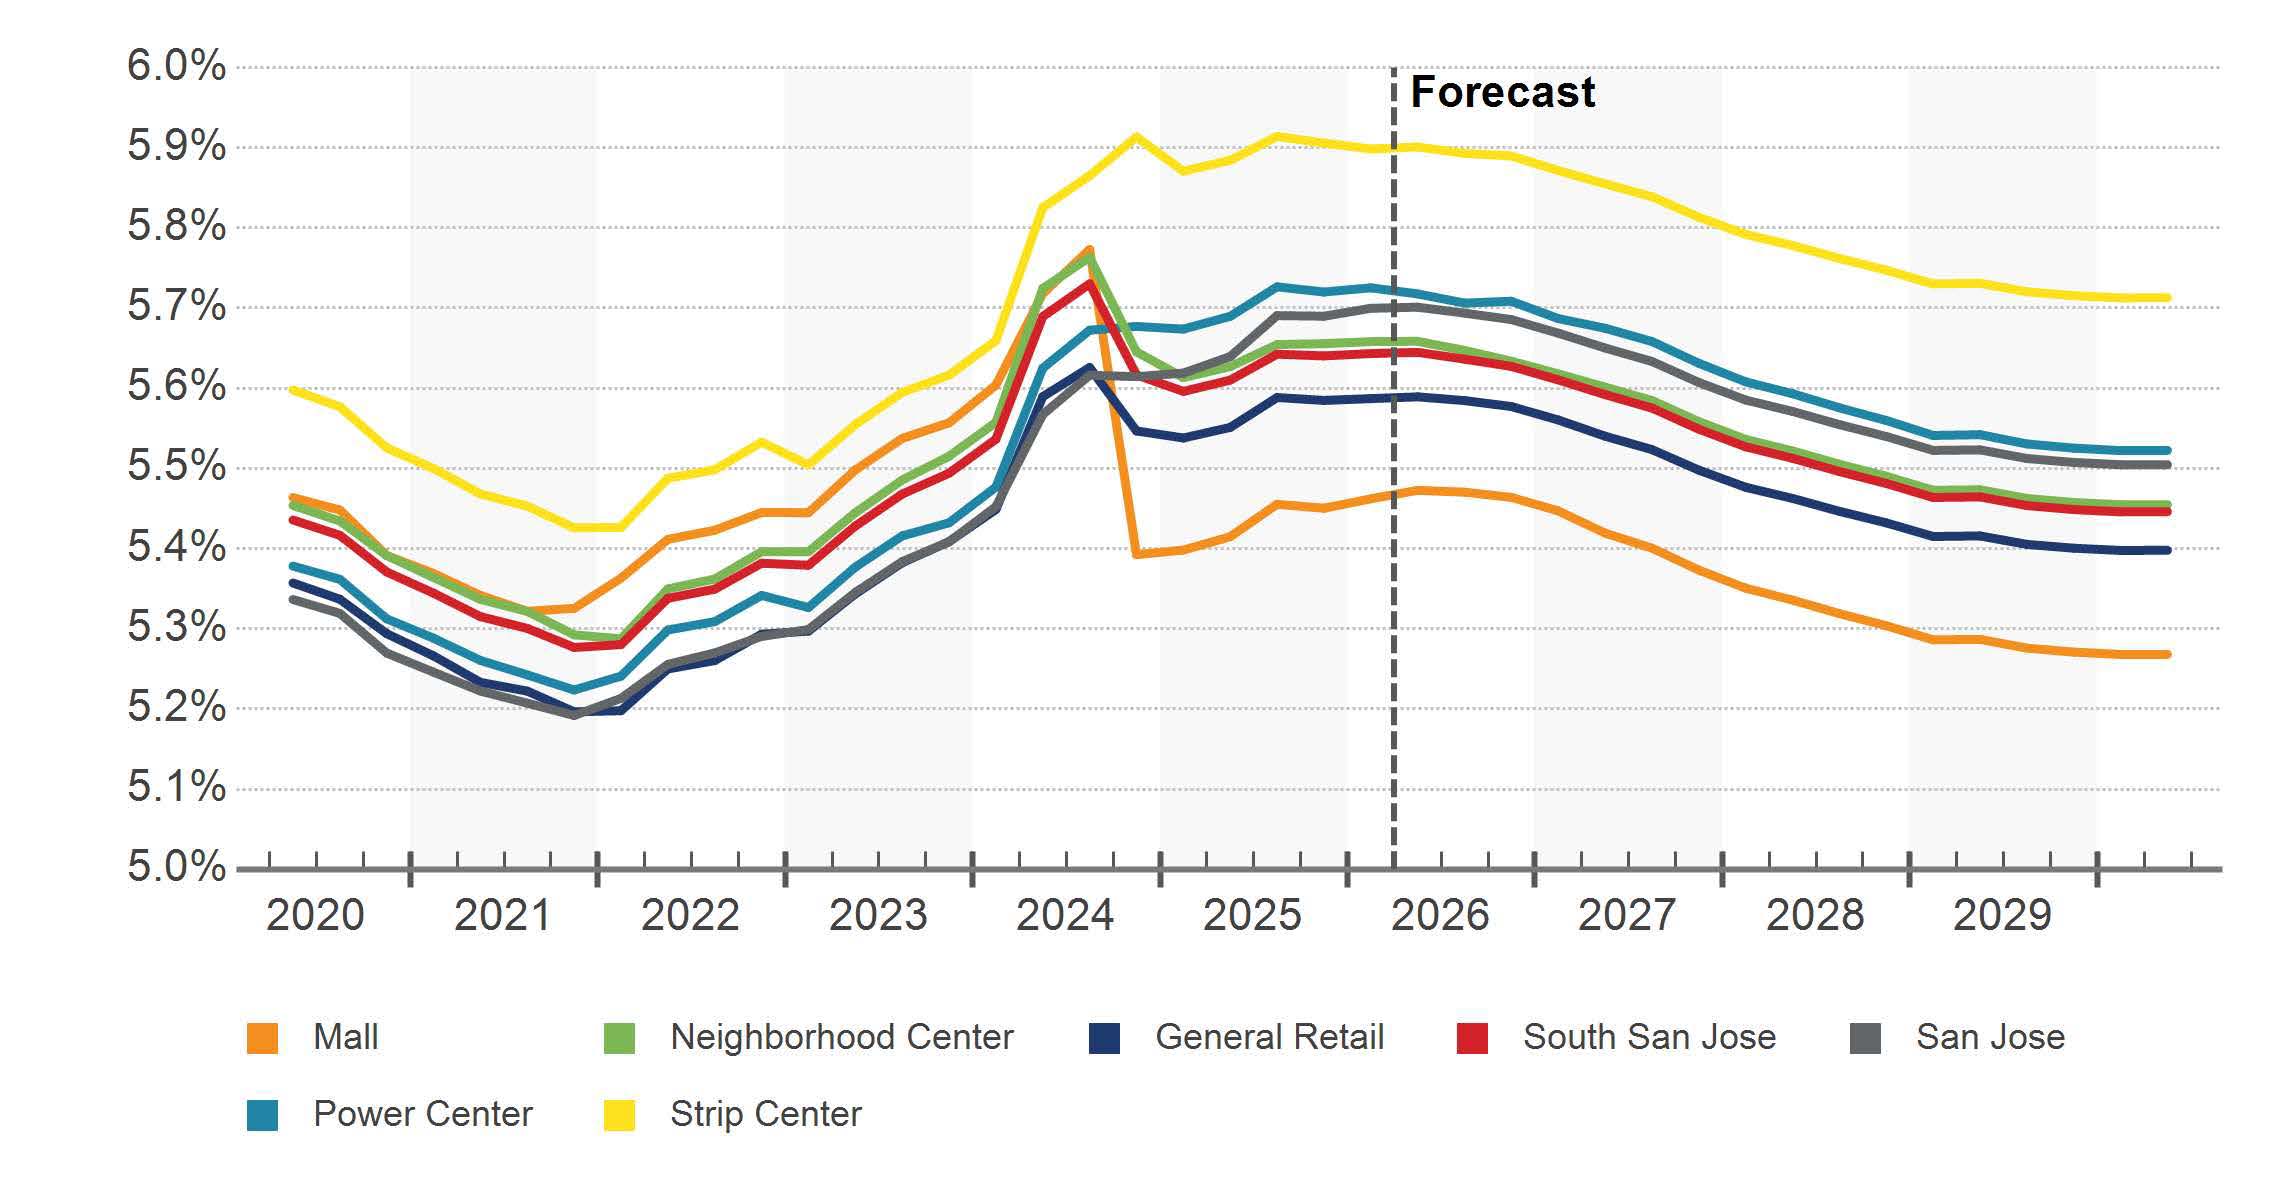
One-stat takeaway for the fund: the average buyer in this submarket already prices in 20% vacancy. Subject is 100% vacant; we underwrite it that way. The income approach later in this deck shows you exactly how that flows through.
Section 01 · Synthesis · The lens for the offer
Headline submarket numbers favor sellers. Segment numbers don't — and the corridor evidence makes the case for buyer leverage.
Lens — what the data implies
Headline
Submarket vacancy 4.2% looks tight — but neighborhood-center vacancy (subject's segment) is 6.3%, the highest of any subtype.
Rent Growth
Cooled from 10-yr avg 3.1% to 1.4% YoY — sellers don't have pricing tailwinds.
Supply
0 SF under construction; only 20K SF proposed (696 Blossom Hill, 7/2026 start). No absorption tailwind either.
Corridor
3 of 11 surveyed Blossom Hill / Monterey corridor properties are 0% leased (subject + 898 Blossom Hill / Kohl's Plaza + 5506 Monterey Hwy).
Marketing
Subject's 448-day marketing time is consistent with a soft market for vacant Class B/C.
Key Readings
6.3%
NC Vacancy · Subject's Subtype
1.4%
YoY Rent Growth · Cooling
20.3%
Avg Vacancy at Sale · Submarket
448d
Subject Marketing Time
Implication for the offer: seller motivation may be elevated, buyer has pricing leverage, and underwriting must absorb lease-up cost. The headline submarket favors sellers; the segment-level data and corridor evidence don't.
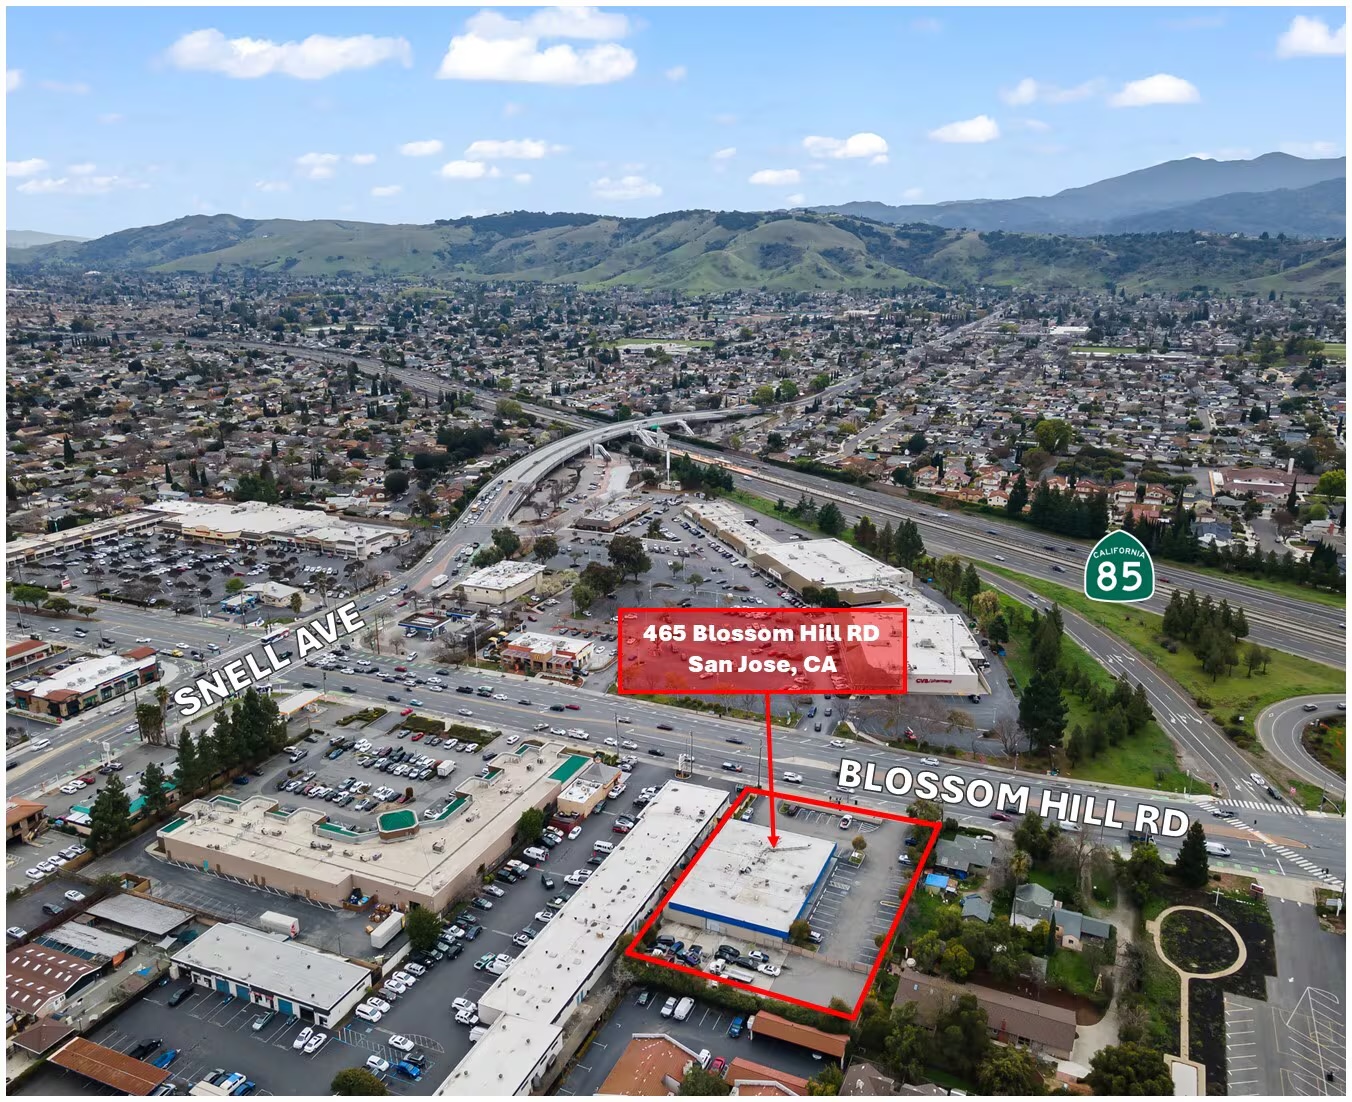
Property Overview
465 Blossom Hill Rd
by the numbers.
Building
| GLA | 10,800 SF |
| Lot | 1.00 AC (43,560 SF) |
| Year Built | 1972 |
| Class | C / 2-star |
| Type | Retail Storefront |
| Stories | 1 |
| Frontage | Blossom Hill |
| Parking | 53 spaces (4.90 / 1,000 SF) |
| Zoning | CP |
| Bldg FAR | 0.25 |
Status & Tax
| Occupancy | 0% (fully vacant) |
| Marketing | ~448 days |
| Tenancy | Single (vacant) |
| Tax 2025 — Land | $3,904,315 |
| Tax 2025 — Imp. | $3,458,108 |
| Tax 2025 — Total | $7,362,423 |
| Tax / SF | $8.44 / SF (2024) |
Seller pricing: Asking $5,988,000 (current OM dated 06.04.25) reflects a leased-asset profile and ignores 100% vacancy plus a $400K–$700K lease-up reserve. The 2025 county assessment ($7.36M) sits above verified vacant-comp evidence.
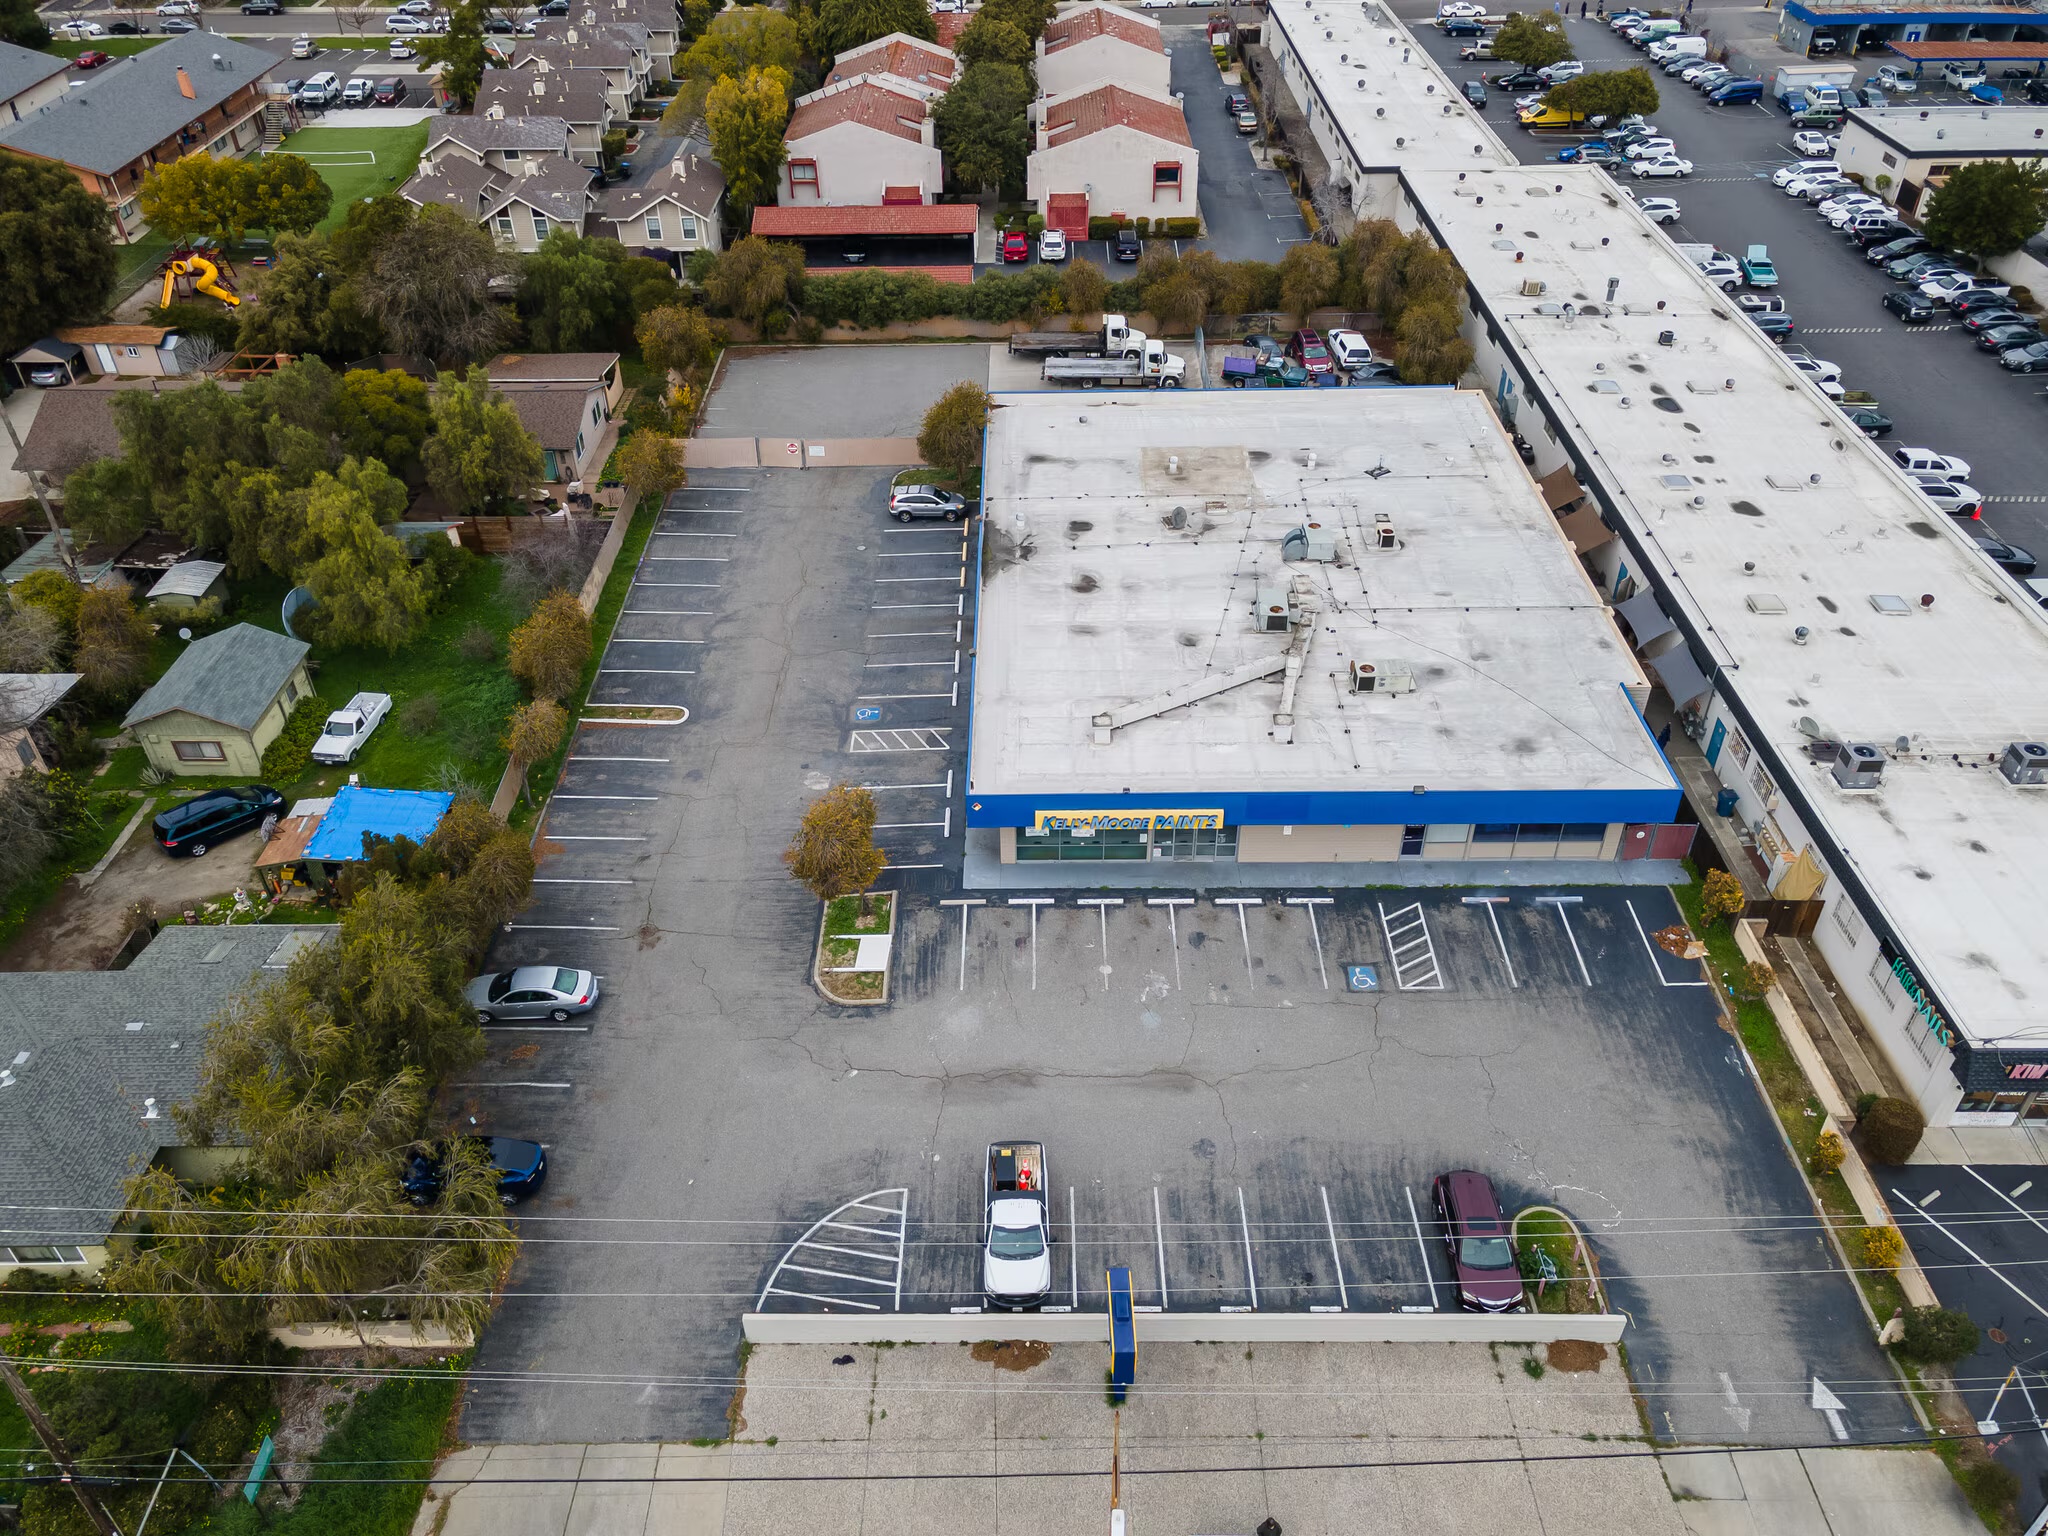
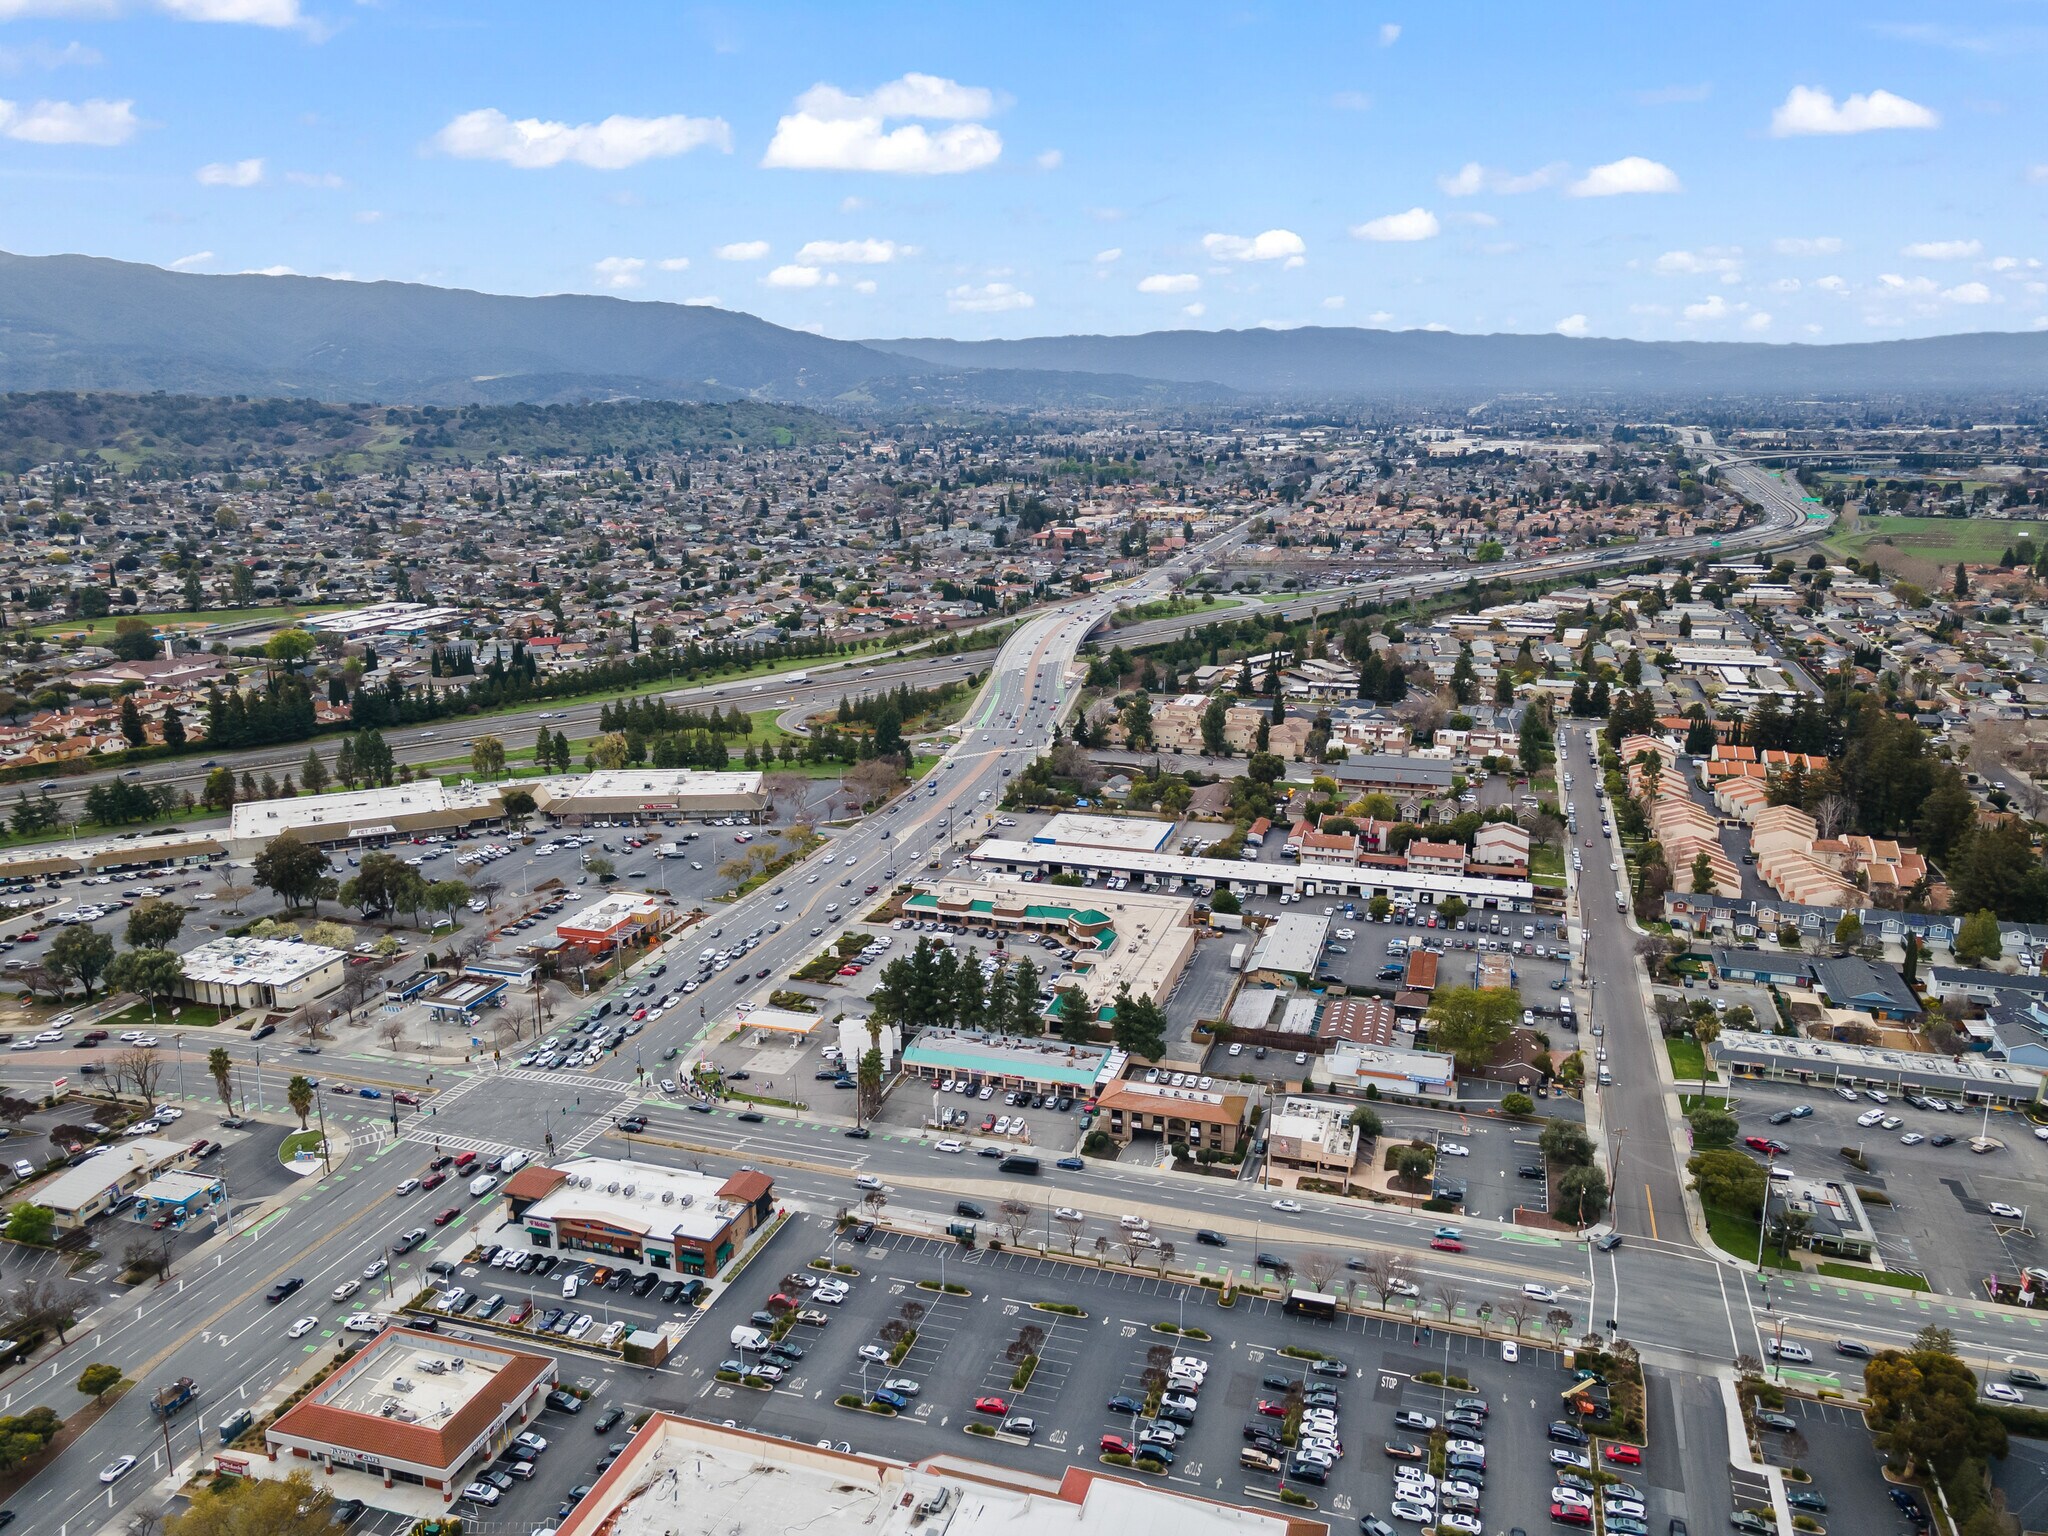
Property exteriors · 465 Blossom Hill Rd, San Jose
Income Capitalization
$3.7M – $4.6M as-is · $4.4M – $5.0M stabilized.
Sales comparison and land/redevelopment — both anchored to vacant comps.
Reconciliation & buyer-path tranches — three approaches, one range, four scenarios.
Sales comp roster — all 7 comps, peach = anchored, ✕ = excluded.
Tax assessment crosscheck — Prop 13* lens.
Lease comps — executed (last 24 months).
Lease comps — active listings.
Market rent conclusion → pro forma NOI build · $28 NNN → ~$264K NOI.
Cap rate sensitivity grid — NOI / cap = indicated value.
Contact · KW Advisors
Alina Siert
Commercial Real Estate, Luxury Residential · Keller Williams Advisors
Direct
(408) 712-7692
Email
Alina@SiertGroup.com
Office
1430 Howard Ave, Burlingame, CA 94010
DRE
01893238